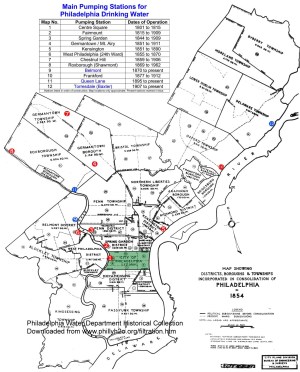
Main Pumping Stations for Philadelphia Drinking Water
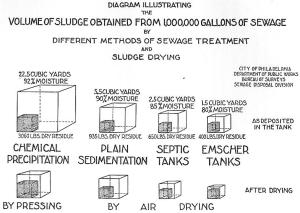
Volume of Sludge from 1,000,000 Gallons of Sewage
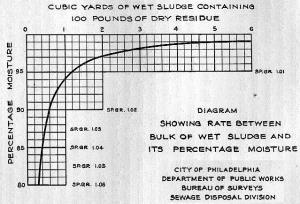
Diagram Showing Rate Between Bulk of Wet Sludge and Its Percentage Moisture
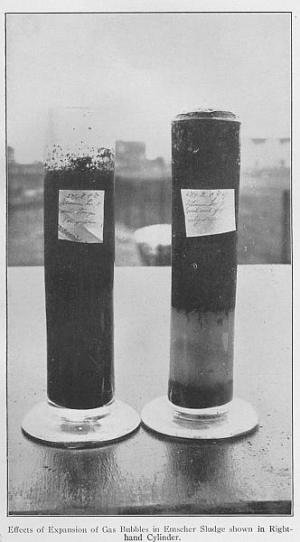
Effects of Expansion of Gas Bubbles in Enscher Sludge Shown in Right-Hand Cylinder
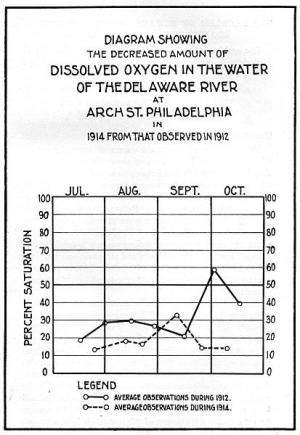
Diagram Showing Decreased Amount of Dissolved Oxygen in Delaware River, 1913
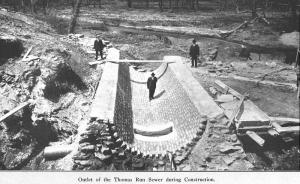
Thomas Run sewer outlet during construction
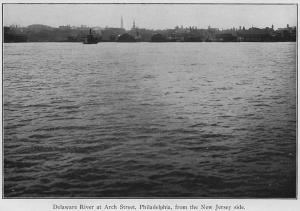
Delaware River at Arch Street from the New Jersey side, 1914
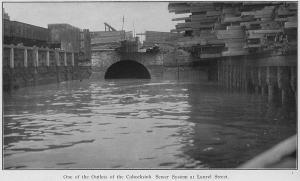
Cohocksink Sewer System outlet at Laurel Street
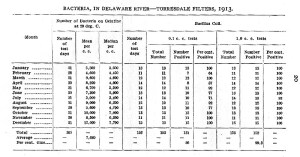
Bacteria in Delaware River, Torresdale Filters, 1913
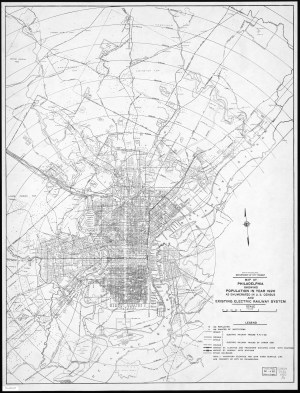
Map of Philadelphia showing Population in year 1920
